There are a number of places on a graph that you can click to change the display. These hotspots save you from having to use menu or toolbar options.
|
This hot spot... |
Does this... |
|
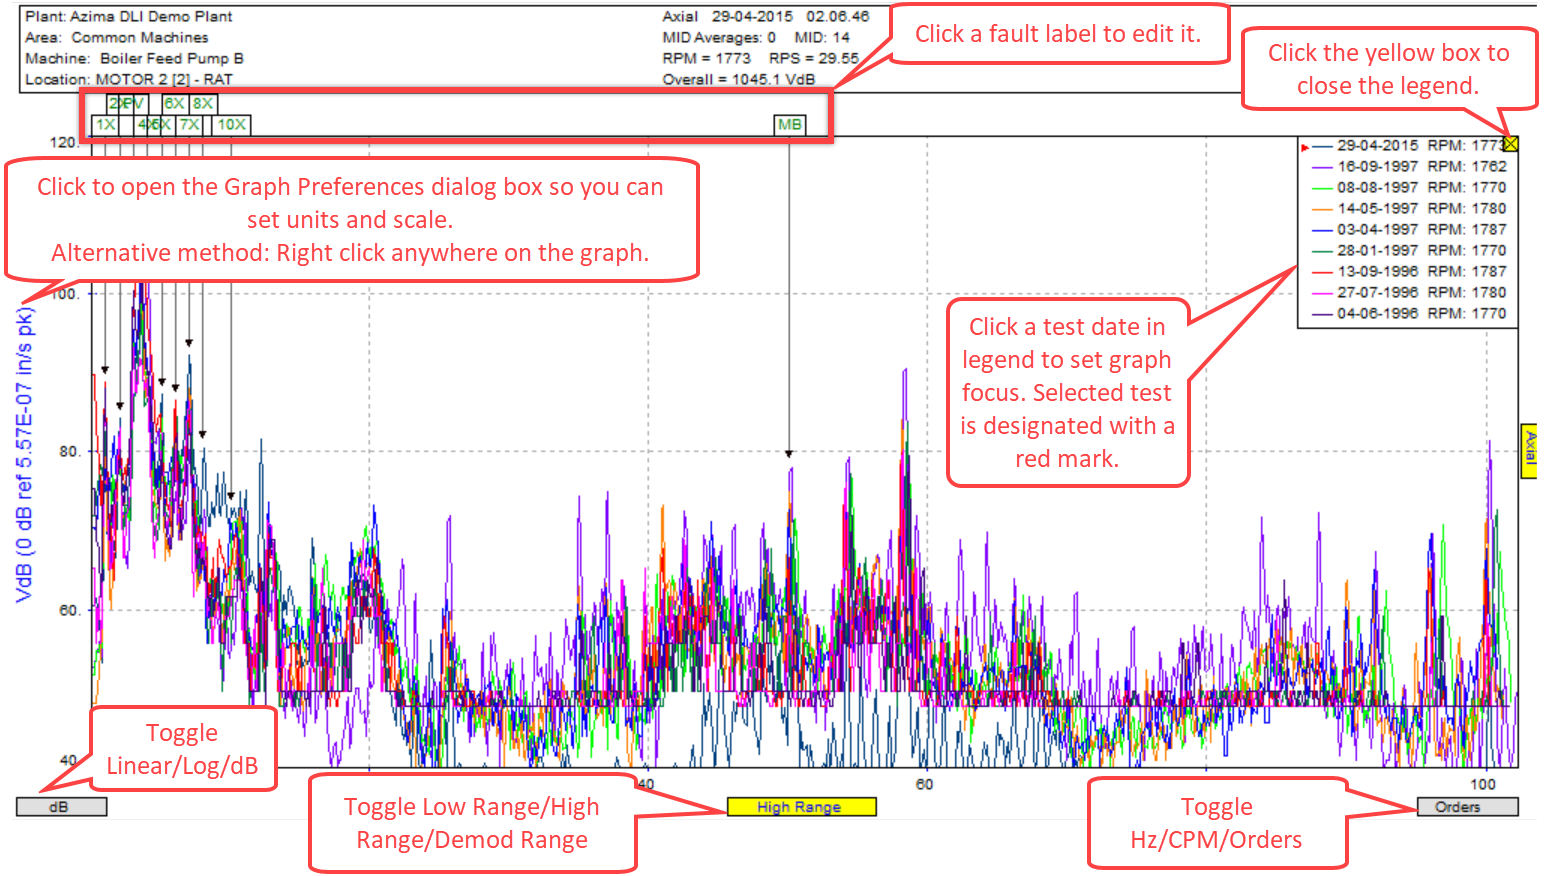
Unit Label |
Click the unit label (or the X- and Y-axis annotation) to open the Graph Preferences dialog box. Alternatively, you can also right-click the graph. |
|
Linear, Log, dB |
Click to toggle between the three states. If there are no dB units defined for a linear unit, it will toggle between Linear and Log. |
|
Low Range, High Range, Demod Range |
Click to toggle between the three ranges. |
|
Orders, Hz, CPM |
Click to toggle the X-axis units and scaling. |
|
Axes |
Click to toggle between the available axes. |
|
Legend |
Hover over the legend to view a tooltip showing the complete detail relating to each of the graphs. Click to give that graph the focus and have the cursor appear on that graph. |
|
Fault Labels |
Click to edit the label and frequency.
|
Comments