Overview
Harmonic markers are small inverted triangles placed on exact multiples of the “fundamental” frequency. The fundamental frequency may be set exactly or you can click a place on the graph and have the nearest frequency used. Harmonic markers may only be set while in Graph View.
To set harmonic markers, you can use the Harmonics button (![]() /
/![]() /
/![]() ) or you can open the graphing Toolbox (
) or you can open the graphing Toolbox (![]() ) and use the Harmonics tab.
) and use the Harmonics tab.
Each method is described below.
Toggling Harmonics
TheHarmonicsbutton on the graphing toolbar can be toggled to three states.
![]() Turns harmonics off on the currently displayed graph.
Turns harmonics off on the currently displayed graph.
![]() Enables track mode so you can click on data in a graph and have its frequency computed and used as the basis of the harmonics. Harmonic marker will be placed at each of the first 20 multiples.
Enables track mode so you can click on data in a graph and have its frequency computed and used as the basis of the harmonics. Harmonic marker will be placed at each of the first 20 multiples.
![]() Turns harmonics on and uses the "entered value" from the Harmonics tab of the Toolbox (see below). Once you toggle to
Turns harmonics on and uses the "entered value" from the Harmonics tab of the Toolbox (see below). Once you toggle to ![]() , click on data on the graph, open the Toolbox (
, click on data on the graph, open the Toolbox (![]() ), and click the Update Harmonic Cursor button. (You may want to adjust the manually entered value or click the enter cursor value button first.)
), and click the Update Harmonic Cursor button. (You may want to adjust the manually entered value or click the enter cursor value button first.)
Harmonics Hotkey
You can also toggle harmonics using the Ctrl+H key on the keyboard. However, this graphing shortcut toggles between TWO states, not three, and is based on the option button selected on the Harmonics tab:
-
If you select Track cursor, the Ctrl+H key will toggle between the tracked cursor and OFF.
-
If you select Use manually entered value, the Ctrl+H key will toggle between the fixed cursor and OFF.
Specifying Harmonics from the Toolbox
- Click the Toolbox button (
 ) on the graphing toolbar to open the Analysis Tools dialog box.
 -
On the Harmonics tab, do the following:
-
Select the View harmonics check box to allow harmonics to appear on the graph. Clearing this check box is the same as turning off harmonics with the Harmonics button (
 ).
). -
Select one of the following option buttons:
-
Track cursor: If you select this option button, whenever you click data in the graph, the exact frequency at that point will be computed and harmonic markers are placed at each of the first 20 multiples.
-
Use manually entered value: If you select this option button, the settings below it are enabled so you can enter the fundamental frequency you want and select its units from the drop-down list. If you want to enter the frequency at the current cursor posting, click the Insert cursor value button. Click the Update Harmonic Cursor button to update the graph based on the values entered.
-
-
-
Click OK.
The following is an example of a spectrum with harmonic markers:
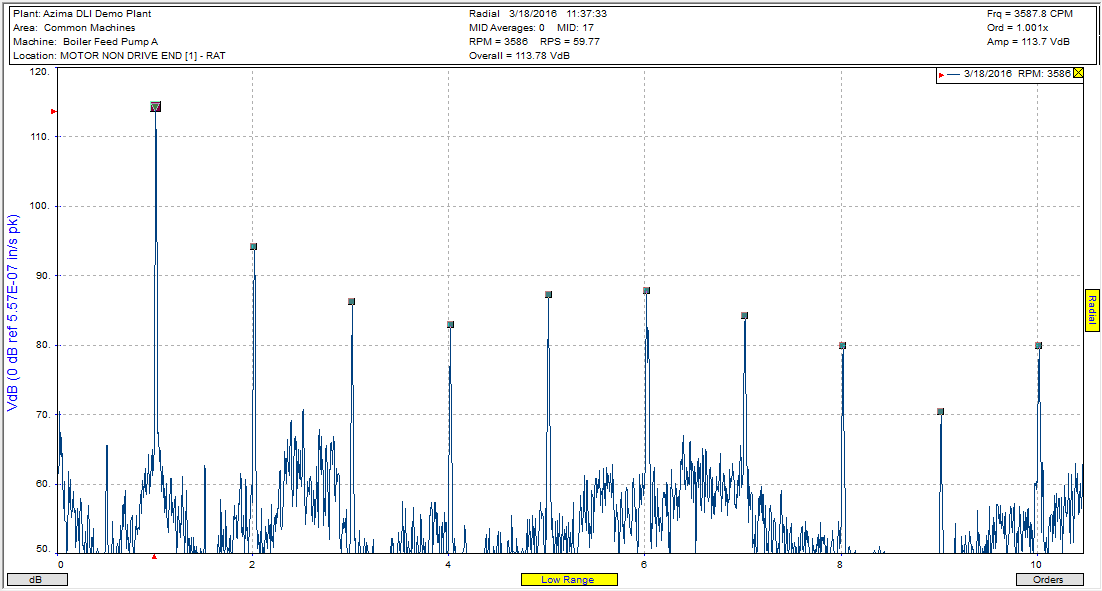
Note: The color used for the harmonic markers is determined by your Graph Preferences. If you want to display harmonics of a fault frequency, Shift+click the fault label, and harmonics will be set up with that frequency automatically.
Comments